When it's June Gloom all around, why do some solar sites still outperform others?
Aug 7
3 min read

June was a tough month for solar operators in Mexico. Most C&I and residential systems missed their generation targets—and many operators are now looking for answers.
"How is it possible that we’re not meeting our commitments, even when we use top-tier simulations? We didn’t even hit our P50."
Take this example: a site that had consistently met its generation targets all year long showed a significant drop in June.

Dig just a little deeper, and the answer becomes clear:June was the rainiest month in Mexico City since 1968—clouds, low irradiance, unstable weather... all of it contributed to systems underperforming against projections.
So no, commitments weren’t met—because the TMY (Typical Meteorological Year) models we use across the industry rely on predictive averages. These are great for planning, but they don’t guarantee monthly results. Some periods—like June—just fall outside the range of what’s expected. It’s part of the game.
The explanation feels obvious: "We didn’t hit the target because of bad weather. Hopefully next month is better."
That’s where most analysis stops.
But there’s much more to the story.
Looking Past the Obvious in Distributed Portfolios
When we dig deeper, new patterns emerge.
Some sites performed exceptionally well—relative to their actual climatic conditions—even if they didn’t reach their original monthly goals.
Others fell far short, even compared to neighboring systems with nearly identical weather.
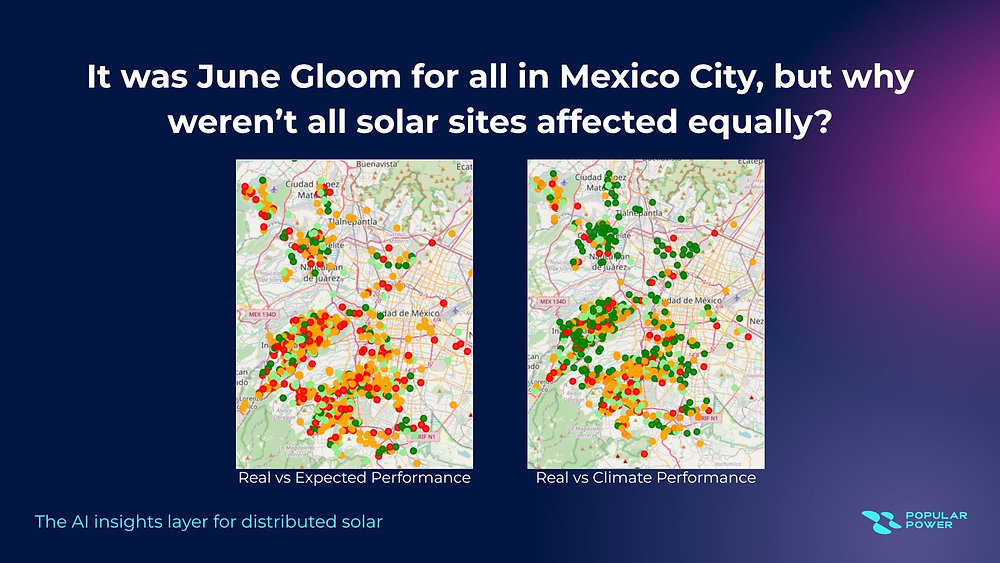
In an analysis of more than 1,200 distributed solar sites in the Mexico City area, we found:
Only 12.8% of sites hit their monthly energy targets
But 56% performed optimally, given the weather conditions in June
The chart below shows how most sites missed their targets, even though their performance was reasonable given the month’s climate.

So what does that tell us? Most sites underperformed relative to their contractual goals, even though many were doing just fine given the actual weather. And in many cases, the issue wasn’t (just) the weather. It was something else: Dirt buildup, seasonal shading, disconnected strings, unbalanced MPPTs…
These are real, fixable problems—and they’ll continue to hurt your performance even during perfect weather.
How to Go "Beyond" in Your Analysis
If you’re only comparing production against a fixed monthly target, everything looks black and white: You either hit the mark or you didn’t. But when you compare against each site’s actual climate potential, you start to see the nuances.

In those nuances lies the opportunity to operate better:
Flag sites that look stable but are underperforming relative to real potential
Identify actual technical issues and take action to increase site generation
Defend lower-than-expected performance to customers—when it’s justified
Prioritize O&M actions with data-backed arguments, avoiding complaints or surprise bills
Popular Power Enables Smarter Decisions
You might be wondering: Do I need to invest in expensive weather stations or simulations to get this level of insight?
No. With Popular Power, it’s simple.
Our platform helps portfolios of any size measure performance against real climate data and site-level targets. It becomes a core part of your operational toolkit, classifying your sites by status and driving real action.
We help you:
Spot where your system is performing well (relative to climate) and where it’s not
Detect anomalies and underperformance before they turn into complaints
Communicate performance clearly—with data to back up how targets were met (or not)
We do this by combining high-quality satellite climate data, generation history, and performance of nearby systems.Then we apply machine learning and feedback loops from your own maintenance logs to build an advanced model that gives you actionable insights, fast.
Because decision-making shouldn’t be black and white. At Popular Power, we give you the tools to optimize performance and contribute your full potential to the energy transition.
Related Posts


© Copyright 2024 Popular Power
The solar future is here. It's getting Popular.